I hope you had read my previous post where I had explained in detail a recent long trade that was in a profit of 500 pips. If you haven’t read that post, you might want to do it before you read this post. Now as I had explained in that post we will continue in the trade as long as there is no bearish divergence appearing on H4 timeframe. This bearish divergence should appear simultaneously on all the three MACD, Stochastic and RSI osillators. If it appears on only one indicator or on two indicators we might take a deep look at what is happening and make a decision. But what we are looking for is a bearish divergence appearing on the 3 oscillators at the same time. When this pattern appears on the 3 oscillators at the same time, it is a very strong signal that the market is taking a turn. The market ultimately found resistance at 1.57517. A clear divergence pattern is appearing on the 3 indicators at the same time. We draw a trendline and wait for the price action to break.
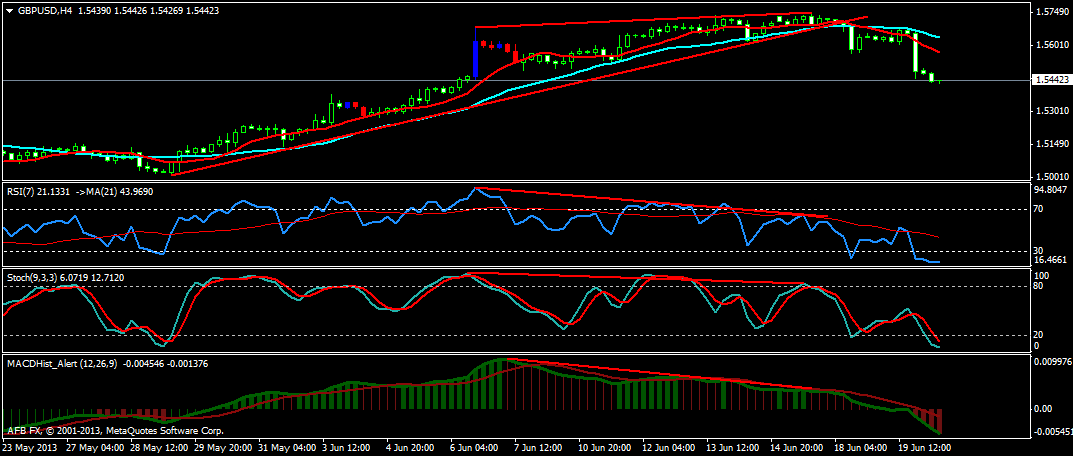
If you have been reading my posts consistently then you must be well aware of my entry technique. I don’t immediately pounce on a divergence pattern and open a trade. I confirm it first by drawing trendlines and waiting for the price action to break plus taking a look at the fibonacci levels on the daily as well as the weekly timeframe plus looking for certain chart patterns like the double top, double bottom and the head and shoulder. Take a look at the following screenshot of the weekly timeframe.
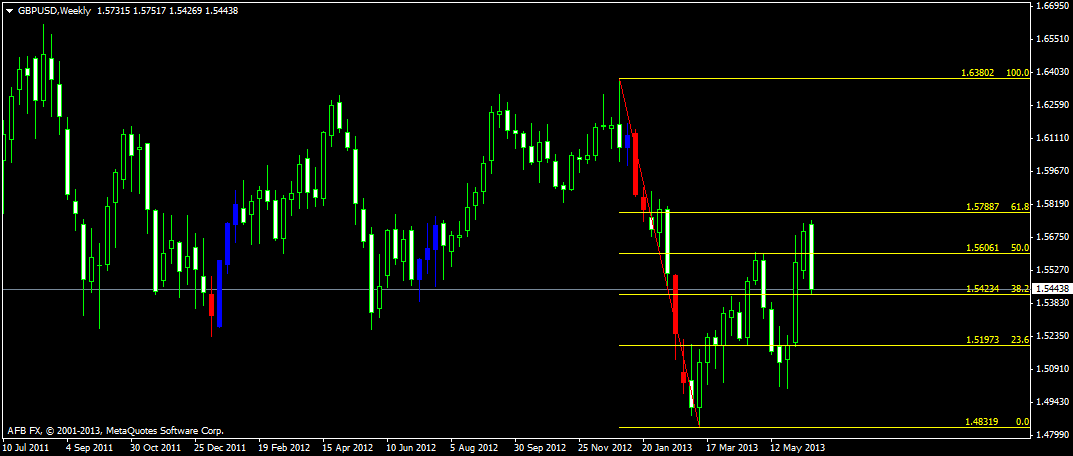
Price came pretty close to the 61.8% fib level on the weekly chart but couldn’t break it. Anyway, once the trendline got broken, we closed the long trade at 1.56907 and open a short trade immediately at 1.56907. Our profit was 660 pips on the long trade. These 660 pips were made in 18 days. So you can see a trade on the H4 timeframe can continue for many days. Once you are in the trade you don’t need to worry much. Just need to monitor the charts daily for just 30 minutes. Just look at the two EMAs on the H4 chart and continue in the trade as long as they don’t cross each other. So when the two EMAs crossed each other and the trendline plus the 61.8% fib level not been broken on the weekly timeframe are three confirmations that price has indeed found resistance and is now turning.
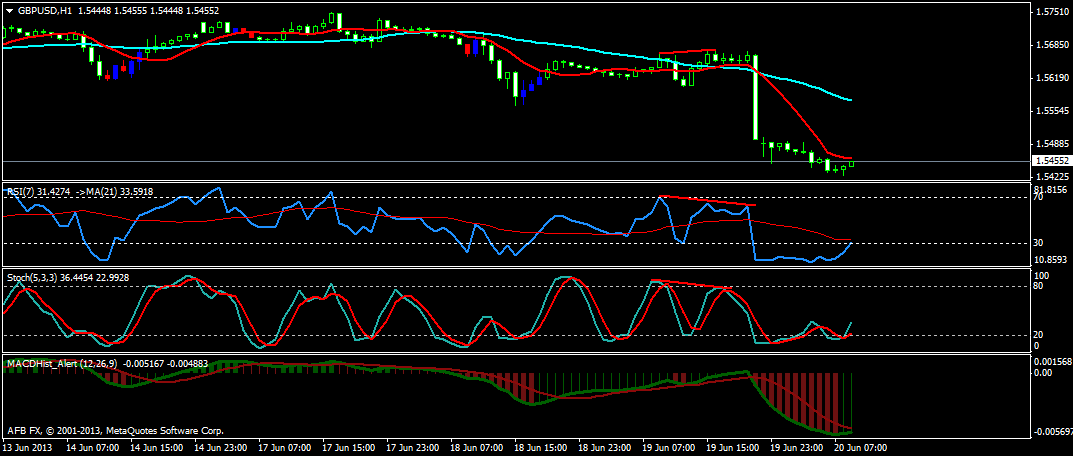
Now if you take a look at the H1 timeframe, you will find a bearish divergence pattern appearing on the Stochastic and the RSI a few hours before the FOMC Meeting Minutes Release which is a clear indication that the market is taking a bearish outlook.
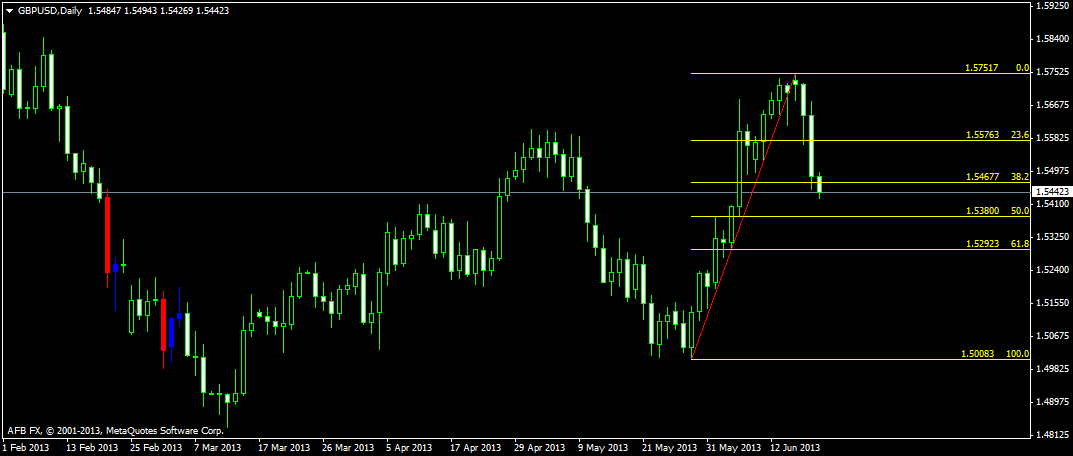
Take a look at this screenshot of the daily timeframe. If you take a closer look a hanging man pattern is appearing at the top which is also a very strong signal that the uptrend is about to end.
Daily you should also take a look at the Forex Factory Economic News Calender. This is a very comprehensive Economic News Calender. Taking a look at this Economic News Calender is important if you are trading on H1 timeframe or on the lower timeframes like M30, M15 or even M5. But since we are trading on H4 timeframe, we don’t really need to take a look at this Calender. On 19th June, there was FOMC Economic Forecast scheduled. I received an email for another pro trader as I am subscribed to his newsletter as well. He was suggesting that you should close all the trades and wait for the FOMC Economic Forecast. Once the FOMC Economic Forecast has been made public, you should re-enter the market. This is what he was doing and suggesting to others.
But I don’t need to close my trade as I have full confidence on my system. The FOMC Economic Forecast has already been compounded into the price and the indicators are showing a bearish outlook. Today when I opened my MT4 platform, I was already in a profit of 250 pips. According to my time zone, FOMC Meeting was supposed to take place at 11:00 PM in the night. So when I opened the MT4 platform in the morning the market had already dropped by 250 pips. Where will the market stop? This is an important question. Take a look at the above daily chart, 50% fib level is one possible turning point. You should also draw fib levels on the weekly chart and see what they are saying. Take a look a the following weekly charts.
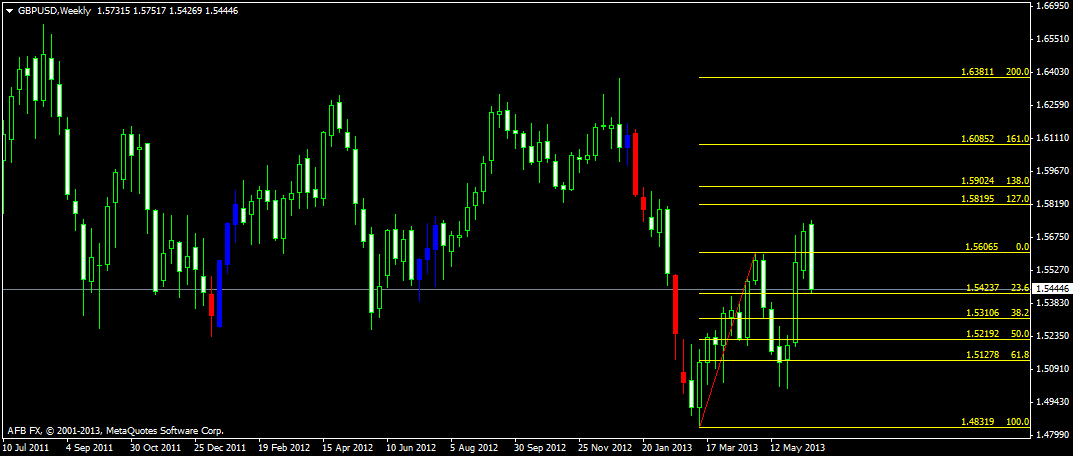
Price has already bounced from the 38.2% level on the weekly chart if you had used the last swing high and the swing low as shown on the chart. Now take another look at the weekly chart with the most recent swing low and swing high.
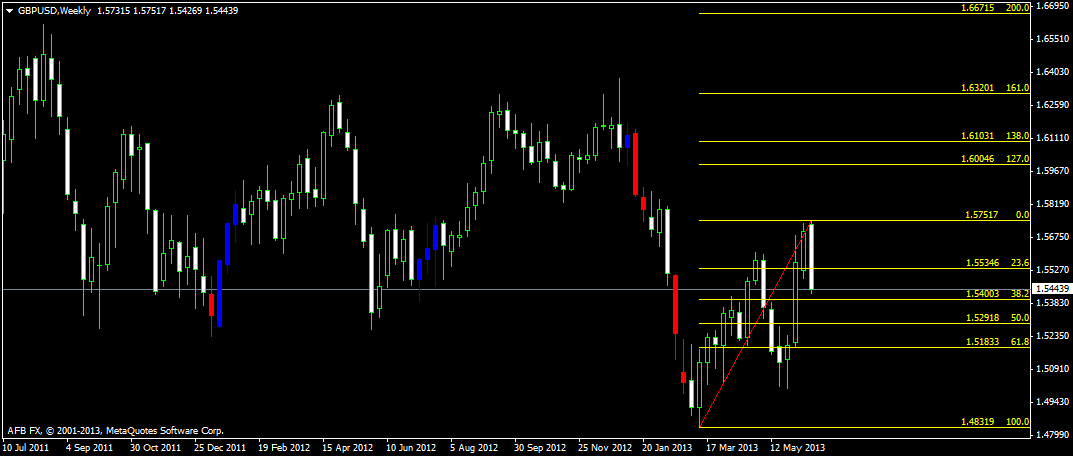
38.2% level is again close so the price can drop down to around 1.5390 level before it find support. With little practice you will also be able to find these support and resistance levels easily. If you want to take you trading to the next higher level, it is always a good idea to trade alongside professional traders. Try Forex Mentor PRO service for 7 days and see how it helps you improve your trading.