Hanging Man is a candlestick pattern that appears at the end of an uptrend as a trend reversal signal. When the Hanging Man appears on the higher timeframe like the daily and the weekly, you need to take it seriously. Take a look at the following recent daily chart screenshot.
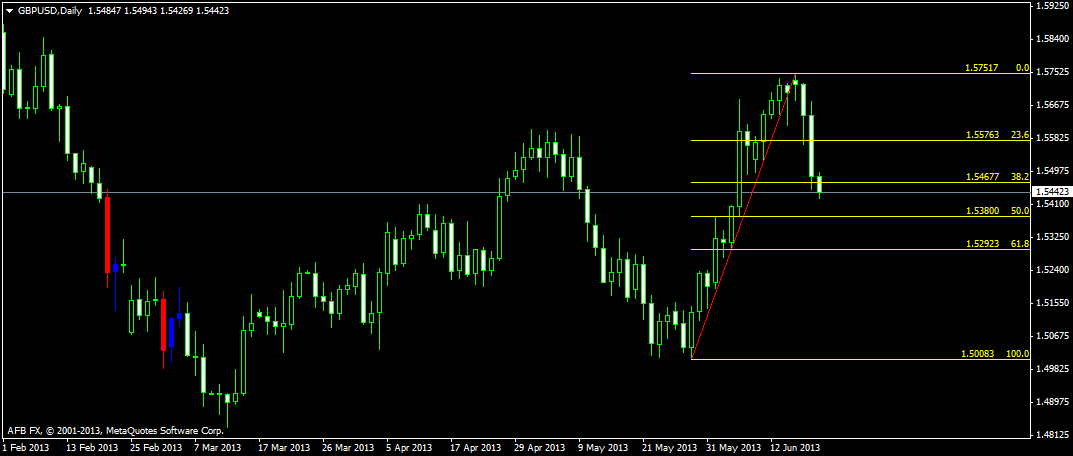
If you take a look at the 0 fib level you will see a hanging man candlestick pattern appearing. After the appearance of the hanging man, you can see three bearish candles forming on the daily chart and the price dropping down more than 300 pips in 3 days. Read this investopedia article on the Hanging Man and what it means. On the lower timeframes candlestick patterns are not strong signals but when you are trading on the higher timeframes like the daily and the weekly, candlestick patterns can give pretty strong signals. Now if you take a look at the following screenshot of the weekly timeframe, you can see that price action tried but could not break the 61.8% fib level.
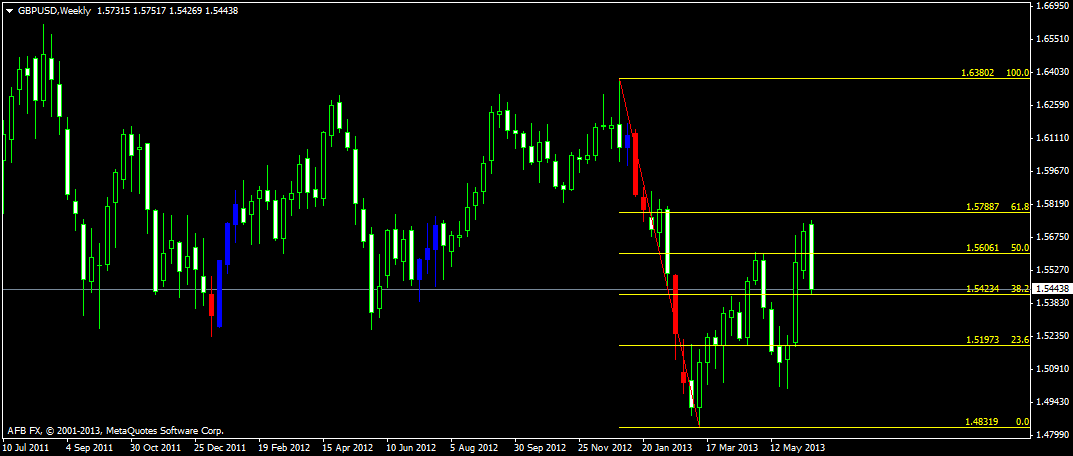
The 61.8% fib level was at 1.57887 but price found resistance at 1.57517 with the appearance of the hanging man pattern. Combining candlestick patterns with fibo levels is a good idea. You cannot trade the candlestick pattern or the fibo levels on their own but when you combine them you can get a pretty strong signal that the market is finding support or resistance at a certain level. If you had traded this hanging man pattern, you would have gone short around 1.57000 level with a stop loss at 1.57517. Your stop loss would have been around 50 pips and you could have easily made more than 250 pips in 3 days. Talk of trading not more than 30 minutes a day! When you are trading on the daily timeframe, you don’t need more than 30 minutes daily to monitor the charts.
The important question once you are in the trade is when to get out. If you take a look at the above screenshot of the daily timeframe, you can see the 50% fib level at 1.53800. Now when the price reaches this level look for a candlestick pattern that signals trend reversal. A trend reversal candlestick pattern appearing on the 50% fibo level means price is bouncing off that level. So combining candlestick patterns with the fibo levels on the higher timeframes like the daily and the weekly can be a strong signal.
Hassam. Thank you. You are a masterful trader and a benevolent gentleman with your trading advice. You have helped me immensely.