In this post I will discuss how to code indicators for NinjaTrader. NinjaTrader is a very powerful trading platform that many traders are missing. Most traders are still stuck with MT4 and MT5 and haven’t looked at NinjaTrader. NinjaTrader is a powerful beast. We can code multi timeframe indicators and strategies using Ninjascript. Coding multi timeframe indicators in MT4/MT5 is not easy due the inherent limitation of MQL4/MQL5. Ninjascript is plain and simple C# framework. You can use the powerful C# libraries in Ninjascript. This is something very powerful. If you know C# you are all set to develop very powerful indicators using Ninjascript. Ninjascript as said above is an event driven framework. In the last post on NinjaTrader and Ninjascript, I could not do justice as I was not well conversant with C# and Ninjascript. Now I am. I have developed a few of my indicators in Ninjascript.
Learn C# To Code NinjaTrader Indicators
As said above Ninjascript is an event driven framework written in C#. If you want to code NinjaTrader indicators you will need to learn C# first. C# is a bit difficult as compared to Python. I already knew Python and R and well verse with machine learning using Python and R when I came across NinjaTrader. In a few days, I had realized NinjaTrader is a very powerful trading platform as compared to MT4 and MT5. There is cTrader platform also available in the market. cTrader is also written in C# but lacks the style and elegance of NinjaTrader. cTrader does not provide Point and Figure charts. Charts on cTrader are predefined unlike NinjaTrader where we can choose any custom period. Learning C# means you can also code indicators on cTrader and later on you can learn Unity and Xenko and develop games on these gaming engines. You can code chating bots and even AI assistants. So learning C# will open up a lot of avenues for you that you can use in your career later on.
C# is a powerful modern object oriented programming language that is being used in building enterprise solution software. This is unlike Python which is more popular in academia and in the scientific community and mostly being used in prototyping. The production code is either written in C++, Java or C#. Python is also great and I love Python and enjoy writing code in it. But after learning C# you will have the confidence to build big robust enterprise level software. In the beginning I was reluctant to learn coding. I thought, I am a manual trader and I should not waste my time in learning coding. Then with the passage of time, I realized as a manual trader it is hard to compete with trading algorithms.
Days of Manual Trading Are Over
I just want to tell you this:”The days of manual trading are over now.” As a manual trader you will never be able to compete with the fast algorithms that have been coded with sophisticated mathematical strategies into them. Trading algorithms also known as trading bots can make very fast decisions as they can process huge quantity of information in less than a second. As a manual trader you will only stare at the charts while the market moves very fast. Let’s go down in history. Point and Figure charts got invented around the end of the 19th century when Dow Jones Industrial Average got created by Charles Dow. Around this time Swing Charts got created and traders started using moving averages. This stuff was pretty advanced then and most of the calculations used to be done by hand. People would draw Point and Figure charts on paper. Point and Figure charts eliminate time from the chart and we have an x or a o only if price moves a certain fixed amount known as a Box. 3 Box Reversal Point and Figure Chart is the standard format. You should understand the economic fundamentals that drive the currency markets. Did you read the post on the economic indicators that move the financial markets big time?
Renko Charts Are Becoming Popular
Japanese have given us the candlestick charts. Candlestick charts are good in giving you the mood of the market on different timeframes. Then Japanese invented the Renko Charts. Renko Charts are the Japanese answer to Point and Figure Charts. Renko Charts also eliminate time from the chart. Renko means a brick in Japanese.
Today around 80% of the trades made at NYSE are being made by trading robots. Manual traders can’t just compete with the trading robots. Know why? Trading robots never tire and fatigue while manual trading is a tiring and a fatiguing process. Trading has become a playing field for coders and quants. As said above big institutions like the banks and hedge funds employ Ivy League graduates in maths for the sole purpose of developing algorithmic trading systems. If you want to compete with these trading robots, you will have to learn coding and build your own trading robots. This is the only solution. Read the post on how to build a CNN algorithmic trading strategy.
MACD Color Indicator C# Ninjascript Code
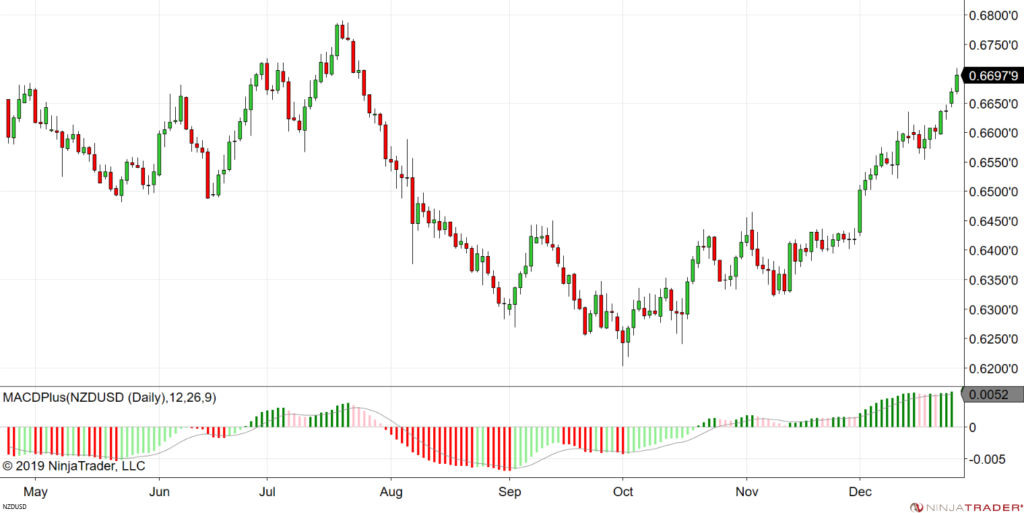
Below I am pasting the Ninjascript code for the MACD Color Indicator. You can see the MACD Color Indicator in action in the above screenshot of NZDUSD daily chart. The color changes when the price momentum changes so we know through the color that momentum is strong or it is getting weak now. Coding an indicator is much easier in Ninjascript. Once you have coded your first indicator you will get familiar with many things in Ninjascript framework like the OnStateChange() method and the OnBarUpdate() method. I will discuss these methods and many other things below so don’t worry at all.
The Series<T> Class in Ninjascript
This concept is very important for you to grasp. Price data is stored as a Series<T> class which is a generic class which implements the ISeries<T> interface. Interface is a concept in C#. C# does not allow multiple inheritance. Multiple inheritance had problems in C++. In order to avoid multiple inheritance problems, C# introduced the Interface which is an abstract method that can be shared between different classes. IComparable, IEnumerable are two inbuilt C# interfaces. There are more and you can define your own as well. ISeries<T> interface has been specially defined in Ninjascript framework. It synchronizes different time series data. For example you can have Series<DateTime> which will store the time stamp of each bar. Series<T> is the heart of Ninjascript and should try to grasp this concept fully. There is cTrader also which is also written in C#. cTrader uses the cAlgo framework which is very different from Ninjascript and lacks the power of Ninjascript. However learning C# will also make it easy to code cAlgo indicators and robots. The Series<T> class is based on the bar concept that we are so used to in technical analysis and is helpful in coding your technical trading strategies.
//
// Copyright (C) 2019, NinjaTrader LLC <www.ninjatrader.com>.
// NinjaTrader reserves the right to modify or overwrite this NinjaScript component with each release.
//
#region Using declarations
using System;
using System.Collections.Generic;
using System.ComponentModel;
using System.ComponentModel.DataAnnotations;
using System.Linq;
using System.Text;
using System.Threading.Tasks;
using System.Windows;
using System.Windows.Input;
using System.Windows.Media;
using System.Xml.Serialization;
using NinjaTrader.Cbi;
using NinjaTrader.Gui;
using NinjaTrader.Gui.Chart;
using NinjaTrader.Gui.SuperDom;
using NinjaTrader.Data;
using NinjaTrader.NinjaScript;
using NinjaTrader.Core.FloatingPoint;
using NinjaTrader.NinjaScript.DrawingTools;
#endregion

// This namespace holds indicators in this folder and is required. Do not change it.
namespace NinjaTrader.NinjaScript.Indicators
{
	/// <summary>
	/// The MACD (Moving Average Convergence/Divergence) is a trend following momentum indicator
	/// that shows the relationship between two moving averages of prices.
	/// </summary>
	/// <summary>
	/// Enter the description of your new custom indicator here
	/// </summary>
	///
	public class MACDPlus : Indicator
	{
		#region Variables
		// Wizard generated variables
		// User defined variables (add any user defined variables below)

			private Series<double> macd;
			private Series<double> signal;


			protected override void OnStateChange()
			{
				if (State == State.SetDefaults)
				{
					Description = @"Enter the description for your
new custom Indicator here.";
					Name = "MACDPlus";
					Calculate = Calculate.OnBarClose;
					IsOverlay = false;
					DisplayInDataBox = true;
					DrawOnPricePanel = true;
					DrawHorizontalGridLines = true;
					DrawVerticalGridLines = true;
					PaintPriceMarkers = true;
					ScaleJustification = NinjaTrader.Gui.Chart.ScaleJustification.Right;
					//Disable this property if your indicator requires
custom values that cumulate with each new market data event.
					//See Help Guide for additional information.
					IsSuspendedWhileInactive = true;
					Fast = 12;
					Slow = 26;
					Smooth = 9;
					AddPlot(new Stroke(Brushes.Green, 4), PlotStyle.Bar, "MacdU1");
					AddPlot(new Stroke(Brushes.LightGreen, 4), PlotStyle.Bar, "MacdU2");
					AddPlot(new Stroke(Brushes.Pink, 4), PlotStyle.Bar, "MacdD1");
					AddPlot(new Stroke(Brushes.Red, 4), PlotStyle.Bar, "MacdD2");
					AddPlot(Brushes.Gray, "Signal");

					AddLine(new Stroke(Brushes.DarkGray), 0, "Zero Line");


			}
				else if (State == State.Configure)
				{
				}
				else if (State == State.DataLoaded)
				{
					macd = new Series<double>(this);
					signal = new Series<double>(this);
				}
			}

			protected override void OnBarUpdate()
			{
				if (CurrentBar == 0)
				{
					MacdU1[0] = 0;
					MacdD1[0] = 0;
					MacdU2[0] = 0;
					MacdD2[0] = 0;
					Signal[0] = 0;

				}
				else
				{

					macd[0] = MACD(Fast, Slow, Smooth)[0];
					signal[0] = EMA(macd,9)[0];
					Signal[0] = signal[0];

					if (macd[0] > macd[1] & macd[0] > 0)
					{
						MacdU1[0] = macd[0];
					}

					else if (macd[0] < macd[1] & macd[0] > 0)
					{
						MacdD1[0] = macd[0];
					}

					else if (macd[0] > macd[1] & macd[0] < 0)
					{
						MacdU2[0] = macd[0];
					}

					else if (macd[0] < macd[1] & macd[0] < 0)
					{
						MacdD2[0] = macd[0];
					}


				}
			}

			#region Properties
			[NinjaScriptProperty]
			[Range(1, int.MaxValue)]
			[Display(Name = "Fast", Description = "Number of bars for fast EMA", Order = 1, GroupName = "Parameters")]
			public int Fast
			{ get; set; }

			[NinjaScriptProperty]
			[Range(1, int.MaxValue)]
			[Display(Name = "Slow", Description = "Number of bars for slow EMA", Order = 2, GroupName = "Parameters")]
			public int Slow
			{ get; set; }

			[NinjaScriptProperty]
			[Range(1, int.MaxValue)]
			[Display(Name = "Smooth", Description = "Number of bars for smoothing", Order = 3, GroupName = "Parameters")]
			public int Smooth
			{ get; set; }

			[Browsable(false)]
			[XmlIgnore]
			public Series<double> MacdU1
			{
				get { return Values[0]; }
			}

			[Browsable(false)]
			[XmlIgnore]
			public Series<double> MacdU2
			{
				get { return Values[1]; }
			}

			[Browsable(false)]
			[XmlIgnore]
			public Series<double> MacdD1
			{
				get { return Values[2]; }
			}

			[Browsable(false)]
			[XmlIgnore]
			public Series<double> MacdD2
			{
				get { return Values[3]; }
			}

			[Browsable(false)]
			[XmlIgnore]
			public Series<double> Signal
			{
				get { return Values[4]; }
			}


		#endregion

	}
}

	#endregion


#region NinjaScript generated code. Neither change nor remove.

namespace NinjaTrader.NinjaScript.Indicators
{
	public partial class Indicator : NinjaTrader.Gui.NinjaScript.IndicatorRenderBase
	{
		private MACDPlus[] cacheMACDPlus;
		public MACDPlus MACDPlus(int fast, int slow, int smooth)
		{
			return MACDPlus(Input, fast, slow, smooth);
		}

		public MACDPlus MACDPlus(ISeries<double> input, int fast, int slow, int smooth)
		{
			if (cacheMACDPlus != null)
				for (int idx = 0; idx < cacheMACDPlus.Length; idx++)
					if (cacheMACDPlus[idx] != null && cacheMACDPlus[idx].Fast == fast && cacheMACDPlus[idx].Slow == slow && cacheMACDPlus[idx].Smooth == smooth && cacheMACDPlus[idx].EqualsInput(input))
						return cacheMACDPlus[idx];
			return CacheIndicator<MACDPlus>(new MACDPlus(){ Fast = fast, Slow = slow, Smooth = smooth }, input, ref cacheMACDPlus);
		}
	}
}

namespace NinjaTrader.NinjaScript.MarketAnalyzerColumns
{
	public partial class MarketAnalyzerColumn : MarketAnalyzerColumnBase
	{
		public Indicators.MACDPlus MACDPlus(int fast, int slow, int smooth)
		{
			return indicator.MACDPlus(Input, fast, slow, smooth);
		}

		public Indicators.MACDPlus MACDPlus(ISeries<double> input , int fast, int slow, int smooth)
		{
			return indicator.MACDPlus(input, fast, slow, smooth);
		}
	}
}

namespace NinjaTrader.NinjaScript.Strategies
{
	public partial class Strategy : NinjaTrader.Gui.NinjaScript.StrategyRenderBase
	{
		public Indicators.MACDPlus MACDPlus(int fast, int slow, int smooth)
		{
			return indicator.MACDPlus(Input, fast, slow, smooth);
		}

		public Indicators.MACDPlus MACDPlus(ISeries<double> input , int fast, int slow, int smooth)
		{
			return indicator.MACDPlus(input, fast, slow, smooth);
		}
	}
}

#endregion
In the above code, there are many things that I need to explain in detail especially if you are new to the NinjaTrader Ninjascript event driven framework. So let’s get started. First are the using statements. In the beginning we inform the compiler what class libraries we will be using. In C#, similar classes get grouped together into libraries that we then use. We can also group class libraries into namespace. Namespace are collection of class libraries. This is just done to make coding big projects easy. Defining a variable in the class library makes it easy to manage as different class libraries are referenced with these using statements. Did you read the post on how to predict stock prices using Facebook Prophet?
I hope you have installed Visual Studio 2019 on your laptop as this is the best IDE when it comes to developing C# applications. NinjaTrader has got its own NinjaScript Editor. You can also use it if you want. In the NinjaScript Editor there is a link to the Visual Studio in the menu bar. You can click on it and it will take you to the Visual Studio if you want already installed it. If you haven’t then of course, nothing will happen. Just below the using statements we have the NinjaTrader.NinjaScript.Indicators namespace. As I had said above namespace is just a collection of class libraries. Class libraries are also known as Assemblies in C#. There is another namespace in NinjaScript NinjaTrader.NinjaScript.Strategies.
Each indicator is a class. Everything is a class in C#. When we code an indicator in NinjaScript we code it as a public class which is part of the NinjaTrader.NinjaScript.Indicators namespace. We can call one indicator from another indicator if we want for that we have to code some properties which then allow us to call that indicator in another indicator. In the above case we have the MACDPlus class. I just open the MACD indicator code from the Indicators folder and then used save as and rename the indicator MACDPlus. I named it MACDPlus because it is basically the same MACD only thing extra is the color bars when the MACD bar increases we have a green bar and when it decreases we have a red bar. If you have been trading MACD, you know each bar is just the difference of two EMAs. One EMA is fast and the other is slow. IN the standard MACD the color of the bars is always grey so you don’t have a clear picture when the bar is increasing or decreasing. When the bar is increasing we have momentum increasing on the upside meaning the up trend is strong. When the bar is decreasing we have momentum increasing on the downside meaning we have a strong down trend. When the color changes from red to green or from green to red it means the momentum has changed direction. After the namespace declaration we define the variables which are private meaning they can only be used in the indicator and cannot be called from outside of that indicator from any other indicator. As said above we use properties to interact with other indicators which is the safe thing. Class level variables are also known as fields. So at the top of the code first we define the fields and if we want to share these fields with other indicators we use their properties.
OnStateChange() and OnBarUpdate()
OnStateChange() is the heart of the indicator. It is an event driven method that is called when the state of the indicator is changed. It has got three states. First is the State.SetDefaults. State.SetDefaults is used to set the indicator properties. The best thing about Ninjascript is that it is truly multi timeframe meaning we can use as many price data series as we want in our indicator. OnBarUpdate() is the heart of the indicator. OnBarUpdate() method runs on the update of each bar. In this method we code our indicator. As said above prices series High, Open, Low and Close are Series<double> generic classes that implement the ISeries<T> interface. When I discuss the multi timeframe indicator below I explain in detail how OnBarUpdate() method runs for each data series that we include in the State==State.Configure.
NinjaScript Properties
Ninjascript properties allow you to expose variables and fields to the other indicators and strategies. Two indicators communicate with each other through properties. You must be familiar with the concept of a property in C#. Fields are class level variables which we want to hide and not expose to the other classes. So we always make them private or protected. Properties are methods that allow us to expose private fields to other classes. Properties have advantages and allow us to control how we expose a field to other classes. Properties can be data series, visual lines, plots as well as indicator parameters. In case of MACD of course this would be slow EMA, fast EMA and the signal line. We can make the indicator time series as a public property and then share it with other indicators meaning if we want to call this indicator in another indicator we can do that if we have provided the property directives.
Multi Timeframe MACD Trend Analyzer Indicator
Below I am posting the code for a multi timeframe MACD Trend Analyzer indicator. This Trend Analyzer indicator looks at MACD on 9 different timeframes and then makes a decision based on majority voting. Sounds interesting? You can take a look at the code below and see how easy it is to code multi timeframe indicators in Ninjascript. If you try to do multi timeframe indicators in MQL4/MQL5 you will come up with a lot of problems. Ninjascript is pure and simple C#. When you are coding in Ninjascript you are coding in C# which is something very powerful. You will realize this when you learn C# how powerful this language is.
#region Using declarations
using System;
using System.Collections.Generic;
using System.ComponentModel;
using System.ComponentModel.DataAnnotations;
using System.Linq;
using System.Text;
using System.Threading.Tasks;
using System.Windows;
using System.Windows.Input;
using System.Windows.Media;
using System.Xml.Serialization;
using NinjaTrader.Cbi;
using NinjaTrader.Gui;
using NinjaTrader.Gui.Chart;
using NinjaTrader.Gui.SuperDom;
using NinjaTrader.Gui.Tools;
using NinjaTrader.Data;
using NinjaTrader.NinjaScript;
using NinjaTrader.Core.FloatingPoint;
using NinjaTrader.NinjaScript.DrawingTools;
#endregion

//This namespace holds Indicators in this folder and is required. Do not change it.
namespace NinjaTrader.NinjaScript.Indicators
{
	public class TrendAnalyzer : Indicator
	{
	#region Variables

		private int[] trend = new int[9] { 0, 0, 0, 0, 0, 0, 0, 0, 0 };

		private Series<int> marketTrend;


	#endregion


		protected override void OnStateChange()
		{
			if (State == State.SetDefaults)
			{
Description	           = @"Determines the trend by looking at multiple timeframes.";
Name                       = "TrendAnalyzer";
Calculate	           = Calculate.OnBarClose;
IsOverlay	           = true;
DisplayInDataBox           = true;
DrawOnPricePanel						= true;
DrawHorizontalGridLines						= true;
DrawVerticalGridLines						= true;
PaintPriceMarkers						= true;
ScaleJustification						= NinjaTrader.Gui.Chart.ScaleJustification.Right;
//Disable this property if your indicator requires custom values that cumulate with each new market //data event.
//See Help Guide for additional information.
IsSuspendedWhileInactive					= true;
BarsRequiredToPlot = 30; // Do not plot until the 30th bar on the chart
			}
			else if (State == State.Configure)
			{
				// Add a 30 minute Bars object - BarsInProgress index = 1
				AddDataSeries(BarsPeriodType.Minute, 30);
				// Add a 1 Hour Bars object - BarsInProgress index = 2
				AddDataSeries(BarsPeriodType.Minute, 60);
				// Add a 2 Hour Bars object - BarsInProgress index = 3
				AddDataSeries(BarsPeriodType.Minute, 120);
				// Add a 3 Hour Bars object - BarsInProgress index = 4
				AddDataSeries(BarsPeriodType.Minute, 180);
				// Add a 4 Hour Bars object - BarsInProgress index = 5
				AddDataSeries(BarsPeriodType.Minute, 240);
				// Add a 6 Hour Bars object - BarsInProgress index = 6
				AddDataSeries(BarsPeriodType.Minute, 360);
				// Add a 8 Hour Bars object - BarsInProgress index = 7
				AddDataSeries(BarsPeriodType.Minute, 480);
				// Add a 12 Hour Bars object - BarsInProgress index = 8
				AddDataSeries(BarsPeriodType.Minute, 720);
				// Add a Daily Bars object - BarsInProgress index = 9
				AddDataSeries(BarsPeriodType.Day, 1);
			}

			else if (State == State.DataLoaded)
			{

				// Comment shortcut Ctrl+K+C
				// Uncomment shortcut Ctrl+K+U
				marketTrend = new Series<int>(this);

			}
		}

		protected override void OnBarUpdate()
		{


			if (BarsInProgress == 1 && CurrentBars[1]==BarsRequiredToPlot)
			{
				if (MACD(12, 26, 9)[1] < MACD(12, 26, 9)[0]) trend[0] = 1;
				if (MACD(12, 26, 9)[1] > MACD(12, 26, 9)[0]) trend[0] = -1;
			}

			if (BarsInProgress == 2 && CurrentBars[2] == BarsRequiredToPlot)
			{

				if (MACD(12, 26, 9)[1] < MACD(12, 26, 9)[0]) trend[1] = 1;
				if (MACD(12, 26, 9)[1] > MACD(12, 26, 9)[0]) trend[1] = -1;

			}

			if (BarsInProgress == 3 && CurrentBars[3] == BarsRequiredToPlot)
			{

				if (MACD(12, 26, 9)[1] < MACD(12, 26, 9)[0]) trend[2] = 1;
				if (MACD(12, 26, 9)[1] > MACD(12, 26, 9)[0]) trend[2] = -1;

			}

			if (BarsInProgress == 4 && CurrentBars[4] == BarsRequiredToPlot)
			{
				if (MACD(12, 26, 9)[1] < MACD(12, 26, 9)[0]) trend[3] = 1;
				if (MACD(12, 26, 9)[1] > MACD(12, 26, 9)[0]) trend[3] = -1;

			}

			if (BarsInProgress == 5 && CurrentBars[5] == BarsRequiredToPlot)
			{

				if (MACD(12, 26, 9)[1] < MACD(12, 26, 9)[0]) trend[4] = 1;
				if (MACD(12, 26, 9)[1] > MACD(12, 26, 9)[0]) trend[4] = -1;

			}

			if (BarsInProgress == 6 && CurrentBars[6] == BarsRequiredToPlot)
			{

				if (MACD(12, 26, 9)[1] < MACD(12, 26, 9)[0]) trend[5] = 1;
				if (MACD(12, 26, 9)[1] > MACD(12, 26, 9)[0]) trend[5] = -1;


			}

			if (BarsInProgress == 7 && CurrentBars[7] == BarsRequiredToPlot)
			{

				if (MACD(12, 26, 9)[1] < MACD(12, 26, 9)[0]) trend[6] = 1;
				if (MACD(12, 26, 9)[1] > MACD(12, 26, 9)[0]) trend[6] = -1;

			}

			if (BarsInProgress == 8 && CurrentBars[8] == BarsRequiredToPlot)
			{

				if (MACD(12, 26, 9)[1] < MACD(12, 26, 9)[0]) trend[7] = 1;
				if (MACD(12, 26, 9)[1] > MACD(12, 26, 9)[0]) trend[7] = -1;

			}

			if (BarsInProgress == 9 && CurrentBars[9] == BarsRequiredToPlot)
			{

				if (MACD(12, 26, 9)[1] < MACD(12, 26, 9)[0]) trend[8] = 1;
				if (MACD(12, 26, 9)[1] > MACD(12, 26, 9)[0]) trend[8] = -1;

			}


			/*LINQ query to determine the trend
			var trendQuery =
				from value in trend
				where value == 1
				select value;
			*/


			var trendQuery1 = trend.Where(num => num == 1);
			var trendQuery2 = trend.Where(num => num == -1);
			if (trendQuery1.Count() >= 5) marketTrend[0] = 1;
			else if (trendQuery2.Count() >= 5) marketTrend[0] = -1;
			else marketTrend[0] = 0;


		}

		#region Properties
		[Browsable(false)]
		[XmlIgnore]
		public Series<int> MarketTrend
		{ get { return marketTrend; } }

		#endregion
	}
}

#region NinjaScript generated code. Neither change nor remove.

namespace NinjaTrader.NinjaScript.Indicators
{
	public partial class Indicator : NinjaTrader.Gui.NinjaScript.IndicatorRenderBase
	{
		private TrendAnalyzer[] cacheTrendAnalyzer;
		public TrendAnalyzer TrendAnalyzer()
		{
			return TrendAnalyzer(Input);
		}

		public TrendAnalyzer TrendAnalyzer(ISeries<double> input)
		{
			if (cacheTrendAnalyzer != null)
				for (int idx = 0; idx < cacheTrendAnalyzer.Length; idx++)
					if (cacheTrendAnalyzer[idx] != null &&  cacheTrendAnalyzer[idx].EqualsInput(input))
						return cacheTrendAnalyzer[idx];
			return CacheIndicator<TrendAnalyzer>(new TrendAnalyzer(), input, ref cacheTrendAnalyzer);
		}
	}
}

namespace NinjaTrader.NinjaScript.MarketAnalyzerColumns
{
	public partial class MarketAnalyzerColumn : MarketAnalyzerColumnBase
	{
		public Indicators.TrendAnalyzer TrendAnalyzer()
		{
			return indicator.TrendAnalyzer(Input);
		}

		public Indicators.TrendAnalyzer TrendAnalyzer(ISeries<double> input )
		{
			return indicator.TrendAnalyzer(input);
		}
	}
}

namespace NinjaTrader.NinjaScript.Strategies
{
	public partial class Strategy : NinjaTrader.Gui.NinjaScript.StrategyRenderBase
	{
		public Indicators.TrendAnalyzer TrendAnalyzer()
		{
			return indicator.TrendAnalyzer(Input);
		}

		public Indicators.TrendAnalyzer TrendAnalyzer(ISeries<double> input )
		{
			return indicator.TrendAnalyzer(input);
		}
	}
}

#endregion
AddDataSeries()
If you look at the above code, I have added 9 data series to the multi timeframe indicator using the AddDataSeries() method. Each data series has its own OHLC. You can access each data series independently and the OnBarUpdate() method will update each data series independently when a new bar becomes due. This is the beauty of Ninjascript. You cannot do this in MQL4/MQL5 as well as cAlgo. Each price data series can run independently. We just need to tell the OnBarUpdate() method BarInProgress==3 so it will run the third price data series. We can access the series with Highs[3][1] which means the third data series High and the first bar. Zero bar is the always the current bar.
Making Sure Data Is Available With CurrentBar
Now I am developing an indicator that is multi timeframe and I am getting repeated errors like the bar is out of range. Why this is happening? This is happening because I am not checking whether the price data is available to the indicator. We can easily check that with the statement CurrentBar < 200 return. This is incase we need more than 200 bars on the chart before we can do the calculations. In the same manner you need to make sure bars are available for each data series that you have included in your indicator or strategy. You can develop full fledged trading strategies also with Ninjascript. For now we only discuss indicators. Just to tell you if you want to trade on NinjaTrader you will have to buy the license which can be $1K+. However if you just want to use NinjaTrader for backtesting and strategy optimization plus indicator development than NinjaTrader is free.
Input Series and Values
You can use any data series in your indicator as an Input. It can be High, Low, Open, Close or any other indicator output series as input. Values are the output. Just like multiple inputs there can be multiple output values. Values are just Series<double> generic object collections. Now these are the values of the plots that we use in the indicator using the AddPlot() method. If you want to take an output that is not a plot value, you will have to use a few tricks otherwise the values will not be taken out. As you learn more indicator coding tricks, you will figure out how to do it. So I don’t explain how to do it and leave it on you when you become a bit advance to figure it out yourself. AddPlot() method is called in the OnStateChange() method in the State.SetDefault part.
Just like the Input data series you can access the output Values like Values[1][1] meaning second bar of the Values series 1. Keep this in mind each data series comprises multiple arrays like Open, High, Low, Close, Volume, Timestamps etc. You can also add data series of multiple instruments. So you are not limited to only one instrument, You can add multiple instruments and use intermarket analysis in the indicator or the strategy. Advances in communication technologies has significantly contributed to integrated the different financial markets and you should think about using intermarket analysis more in your trading strategies.
Drawing Objects On Charts
We use the AddPlot() method to draw objects on charts. We can draw lines, dots, bars and stuff like that. We can also draw arrows up and down with the Draw method. You can infact draw whatever you want using C# namespace System.Drawing. There is no limitation. Once you reach the advanced coding level, you can use ShapeDX to do whatever you can. But you don’t need to be advanced. Even with the beginner level you can do whatever you want with the AddPlot() method. It will suffice for your needs. Many indicators are available by default. Many more are available as AddOns.
You can develop your own AddOns also. The most challenging part in developing an indicator is developing an algorithm that can predict the price. If you can’t predict price with good accuracy you can make a lot of money. You need to know much more than coding now a days to develop a good indicator. That much more is Artificial Intelligence. Everyone talks about AI now a days. You should start taking interest in AI and use it in predicting price action. If you have a good grasp of AI, you should be able to come up with something that gives you an edge over others. You just need a slight edge.
Coding multiseries Ninjascript indicators has some challenges. I was coding a multiseries indicator a few days back. The indicator has around 12 data series. The indicator would work alright but when I would change the primary series it would start giving error on bar 24000 something like that saying it was out of range. I took the error as an interesting learning experience and finally figured out after some hours of work what was happening and why I was getting this error. The error was due to the fact that I was using the list size as 5 in the for loop. I changed that to Count method to check if the list size is indeed 5 before starting the for loop and the error vanished. As reported in the online discussions Ninjascript does have some issues when it comes to multiple data series and especially with MAX and MIN functions. I was using precisely these MAX and MIN in trying to find out the local peaks and valleys in the price series. Whatever, I solved the problem and it was a good experience.
Coding is all about problem solving. The more errors you remove the better coder you will become in the long run. C# collections like the List<T> is a handy tool when it comes to coding indicators and strategies. Tuples can be used in the List collection. This gives you a lot of leverage. Instead of defining your own class or structure I think it is a better option to use the inbuilt Tuples. Whatever it just means the more you master C#, the more you will code better indicators and strategies. As said above learning C# means you can also code indicators and robots on cTrader platform. In nutshell, Ninjascript is a good framework for developing multi timeframe indicators and strategies. MACD is prone to false signals. This happens because MACD is just the difference of two moving averages and you know well moving averages are lagging indicators of price. You will always find an MACD to lag and give late signals when the trend has already midway. You should not use MACD for entry and exit. MACD is a good momentum indicator meaning as long as the trend is going strong, it will tell you that. I use MACD for continuing in a trade.
Using External Assemblies in NinjaTrader
When coding indicators and strategies, you will have the temptation to use external libraries like Accord in your indicator. If you use it you will see Visual Studio compiling the code but the Ninjascript Editor turning red indicating a compilation error. This is what you will do. First create an empty project separate from Ninjascript. In that project call the external library like Accord and then compile it. Once it gets compiled copy the dll file and paste it in the reference in Ninjascript. When you right click on the NinjaScript Indicators project folder you will right click on the references folder in the NinjaTrader Custom folder. After that you will click on Add Reference and then browse and add the dll file. I haven’t actually done it but this is what I have read. I wanted to add Accord.Fuzzy library.
ISeries<T> as said above is the generic interface that Ninjascript provides you to deal with data series. It has some limitations. You cannot use LINQ with it. LINQ is a powerful integrated query tool that is available in C#. You can use LINQ with the System.Collection classes. ISeries<T> does not allow LINQ. So if you want to use it either first convert the ISeries<T> object into a collection object like the List, Dictionary, Queue, Stack etc. After that you can use it. Now it would have been a good idea by the NinjaTrader developer team to somehow link ISeries<T> with LINQ. It might require coding IComparable<T> and stuff like that. Another thing that I found out was I couldn’t define an ENUM. If you try it and define the ENUM as a global variable, you will find the compiler still complaining it cannot find it. The solution is to define an Add-On file and use it to define the all the custom types. This will keep the code clean and also help compile neatly.