In this post we are going to analyze a recent swing trade that made 1000% gain. In this post we will illustrate how to use the concept of support and resistance in your trading. Support is like a floor. Just like when throw the ball down, it hits the floor and bounces up, price also behaves in the same manner. So let’s start. Take a look at the following screenshot of EURUSD H4 chart.

Just look at the 3 4 hour candles below the red arrow. Price is bouncing off the support level of 1.08475. After the 4 candles that bounced off close to the 1.08475 level, price goes up hits the aqua line which is the EMA55 and then races down. It finds strong support at 1.08549 and bounces up strongly forming a strong engulfing candle on H4. This strong engulfing candle formed just 1 hour after the release of the NFP Report is a signal for the start of an uptrend. Expect the price to move up 300-400 pips. Now take a look at the daily candles that was formed.
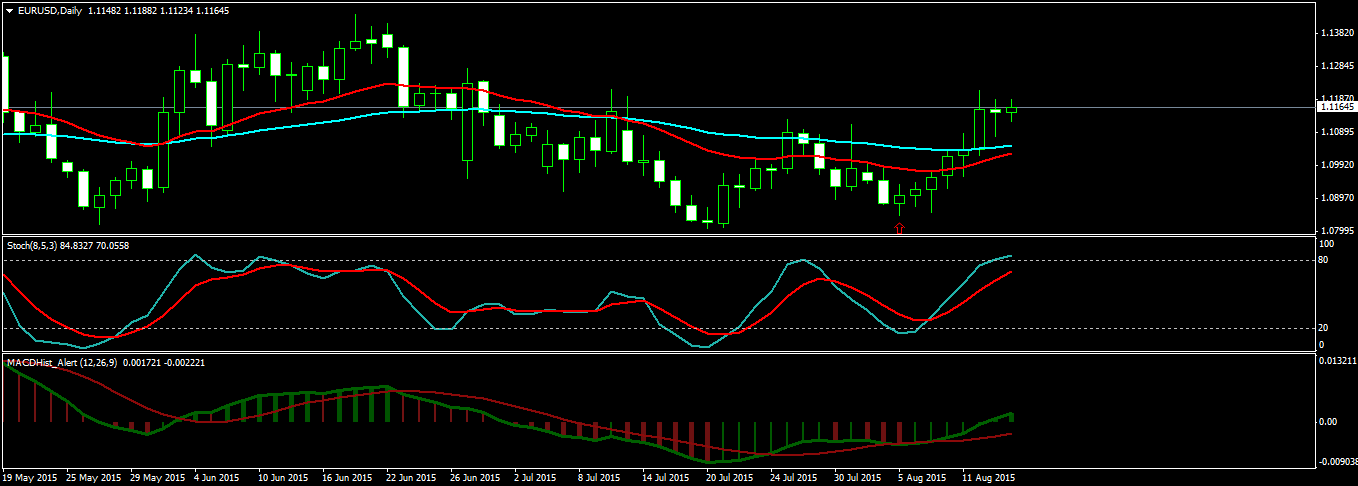
You can see a bullish candle just above the red arrow. The low of this bullish candle is 1.08475. Now the second day another bullish candle was made. You can see that in the above daily chart. The third day is the NFP report release day. Price went down at the time of NFP Report release. It found strong support at 1.08549 and then rapidly recovers all the pips that it lost. Price closed at 1.09593 almost 100 pips above the support level. Now take a look at the following screenshot.
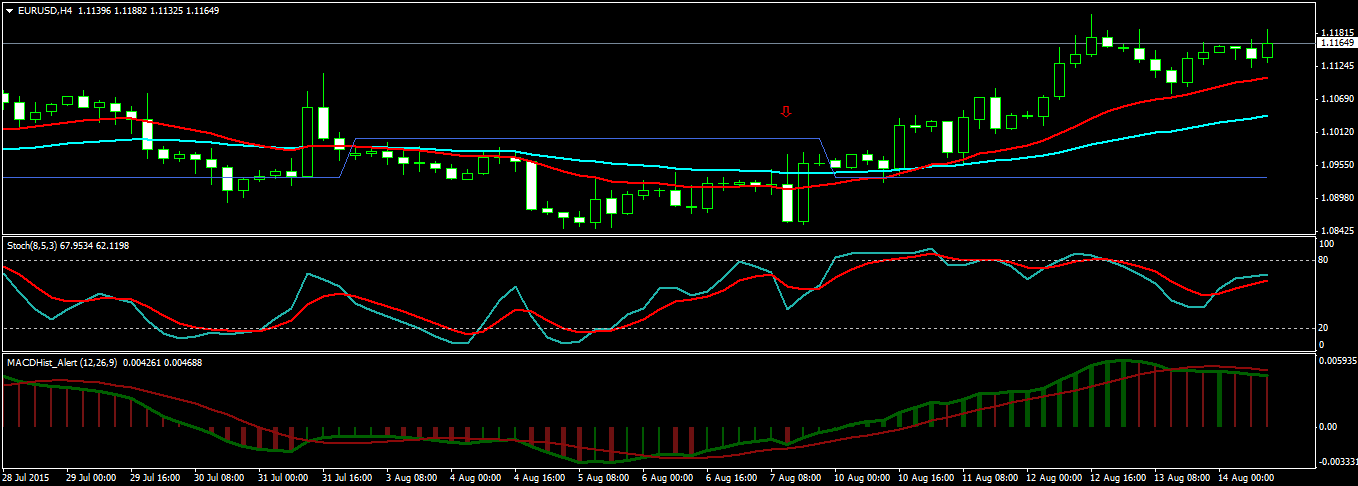
Just below the red arrow you can see the bearish candle formed on the NFP report release. The very next candle is bullish. You can see a strong bullish engulfing candle on the H4 chart which is a strong signal for an uptrend. You can also see a bullish divergence pattern that has been formed. So expect price to rise 300-400 pips next week.
Red arrow shows the bearish candle formed at the time of the NFP Report release. Keep in mind the support level of 1.08475. The price touches 1.08549. We knew price is going to shoot up. So we entered into a long trade at the close of the 1 hour bullish candle at 1.08709. Our stop loss is at 1.08450. Our risk is 25 pips. Suppose we are trading with $1000 in our account. We opened a position with 0.2 lot. Our risk is $50 or just 5%. We are confident that the price has found the floor so we are comfortable with taking a 5% risk. That was it for that week. The next week starts.
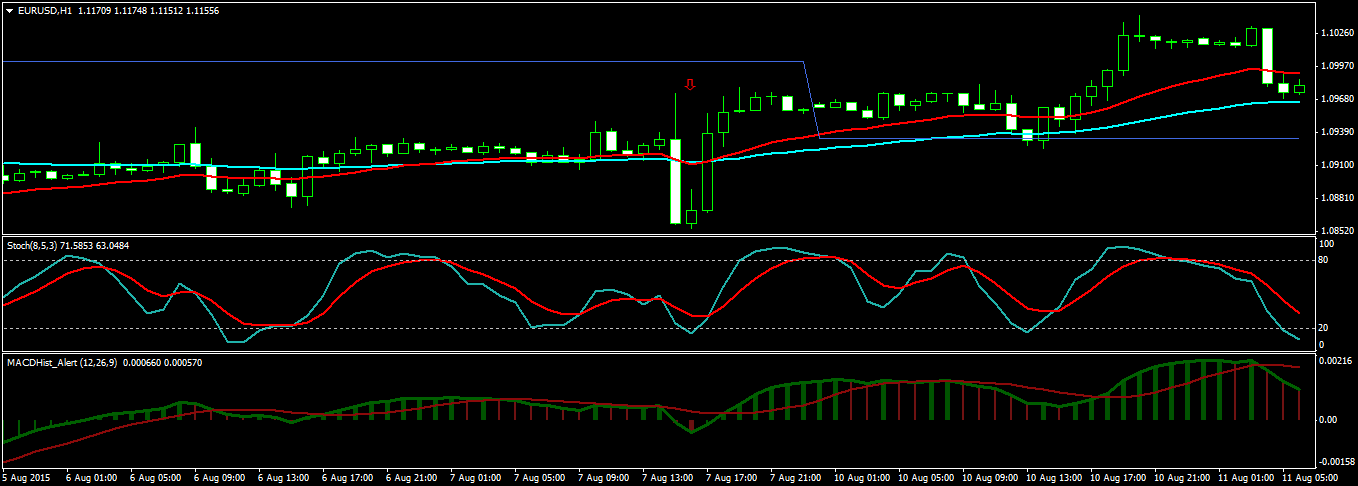
Above is the H1 chart. On Monday, the price retraces to 1.09255. We make an entry just above the red arrow at the close of the bearish candle at 1.09324. Our risk is 10 pips. We move the stop loss from 1.08450 to 1.09250. The first position is in a profit of 55 pips while the second position has a risk of 10 pips. Our net profit is 45 pips. So even if the stop loss is hit, we will end up with a profit of 45 pips. We open a position with 0.3 lots. Our risk is $30. Profit from the first position is $110 while the risk is $30 so our profit is $80.
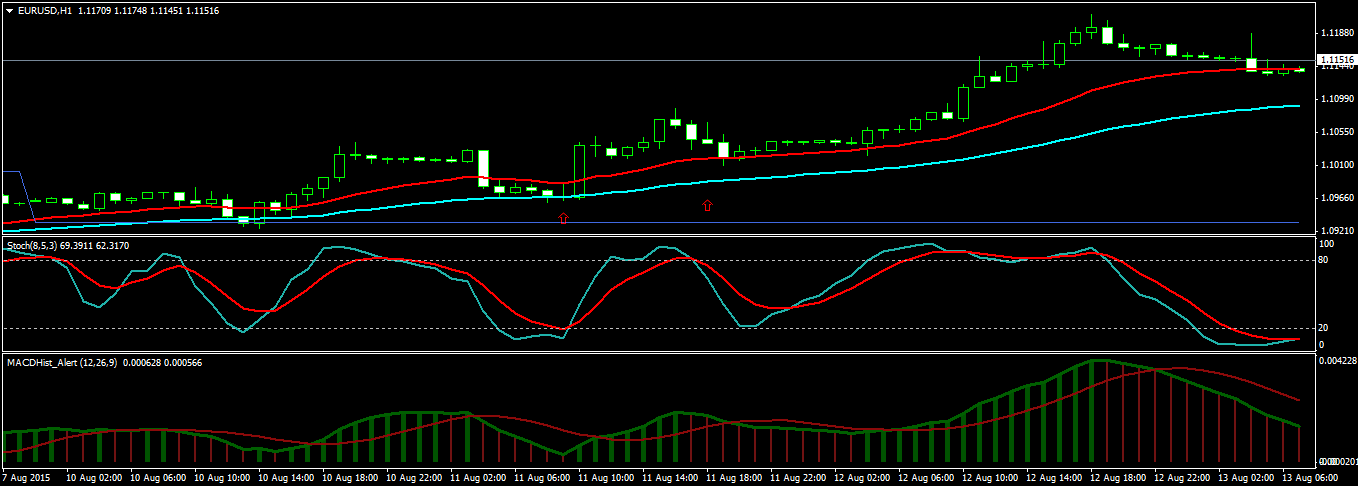
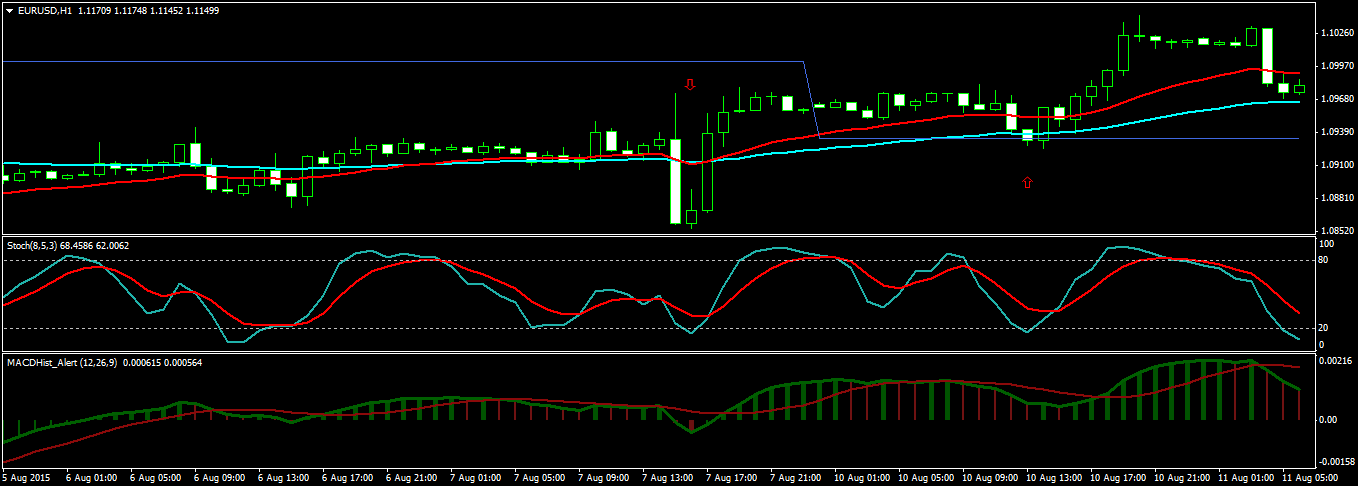
In the above screenshot you can see price moving up then retracing down. We open a new position at 1.09669 and move the stop loss to 1.09550. The risk is 11 pips. We open new position with 0.3 lots. We open another position just above the second red arrow in the above screenshot at 1.10298 and move the stop loss to 1.1000. The risk is 30 pips. We open another position with 0.3 lots. We close our positions at 1.11966.
The first position made a profit of 196+130=326 pips. The profit was $652. The second position made a profit of 68+196=264 pips. Since we had 0.3 lots, this translates into a profit of $792. The third position made a profit of 44+196=240 pips. Since we had 0.3 lots, this translates into a profit of $720. The fourth position made a profit of $507. The total profit was $652+$792+$720+$507=$2701 which translates into a return of 270%. If you had $10,000 in your account, this profit would have translated into $27,010. As you can see trading is all about patience and keeping the risk under control.